Beyond GPS: Using PyQGIS to Build Precision Golf Cue Cards
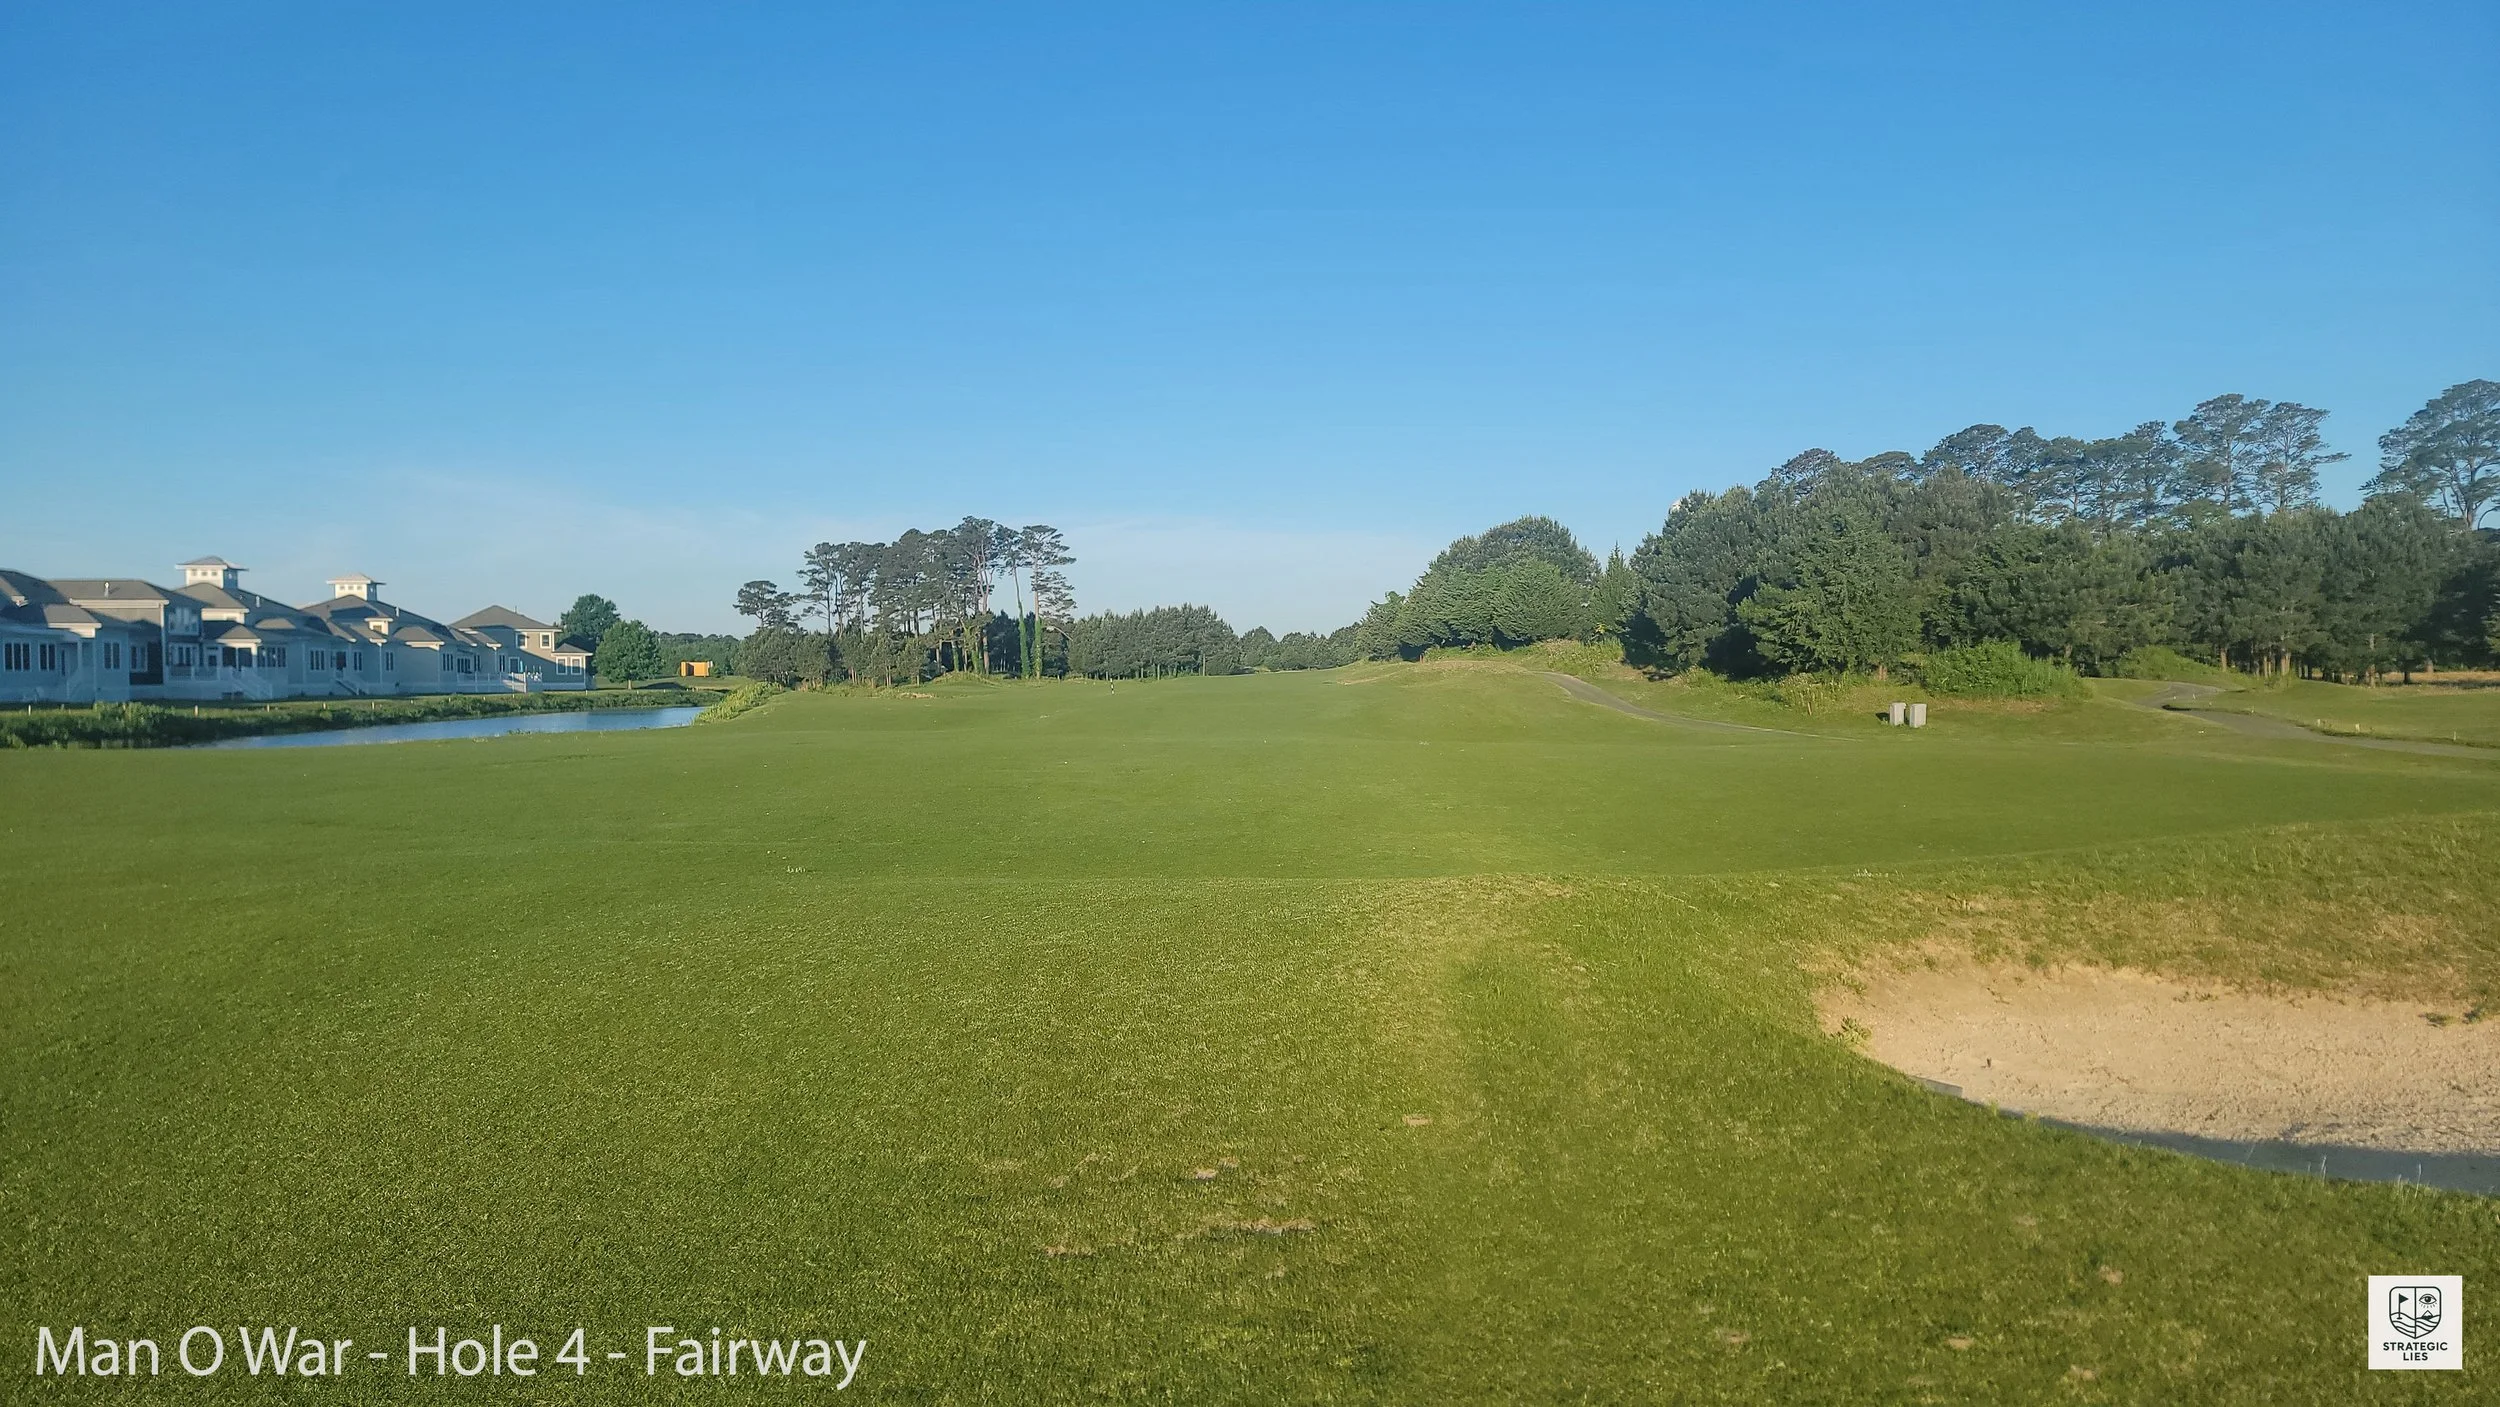
As a golfer, there is nothing quite like the view from the tee box on a course like Rum Pointe in Ocean City, MD. But when you're facing a challenging Par 5 like Hole 13, a standard yardage app often lacks the visual context needed for strategic shot planning.
At Waypoint Studio, I’ve been experimenting with using QGIS, a professional-grade geographic information system, to develop custom "cue cards" that provide dual-perspective range bands. By automating the geometry with Python, I can generate precise, high-fidelity visuals that help golfers visualize their landing zones from the tee and their proximity to the pin on the approach.

The Goal: A Dual-Perspective Advantage
Most golf apps show you how far you are from the hole. My goal was to create cards that show:
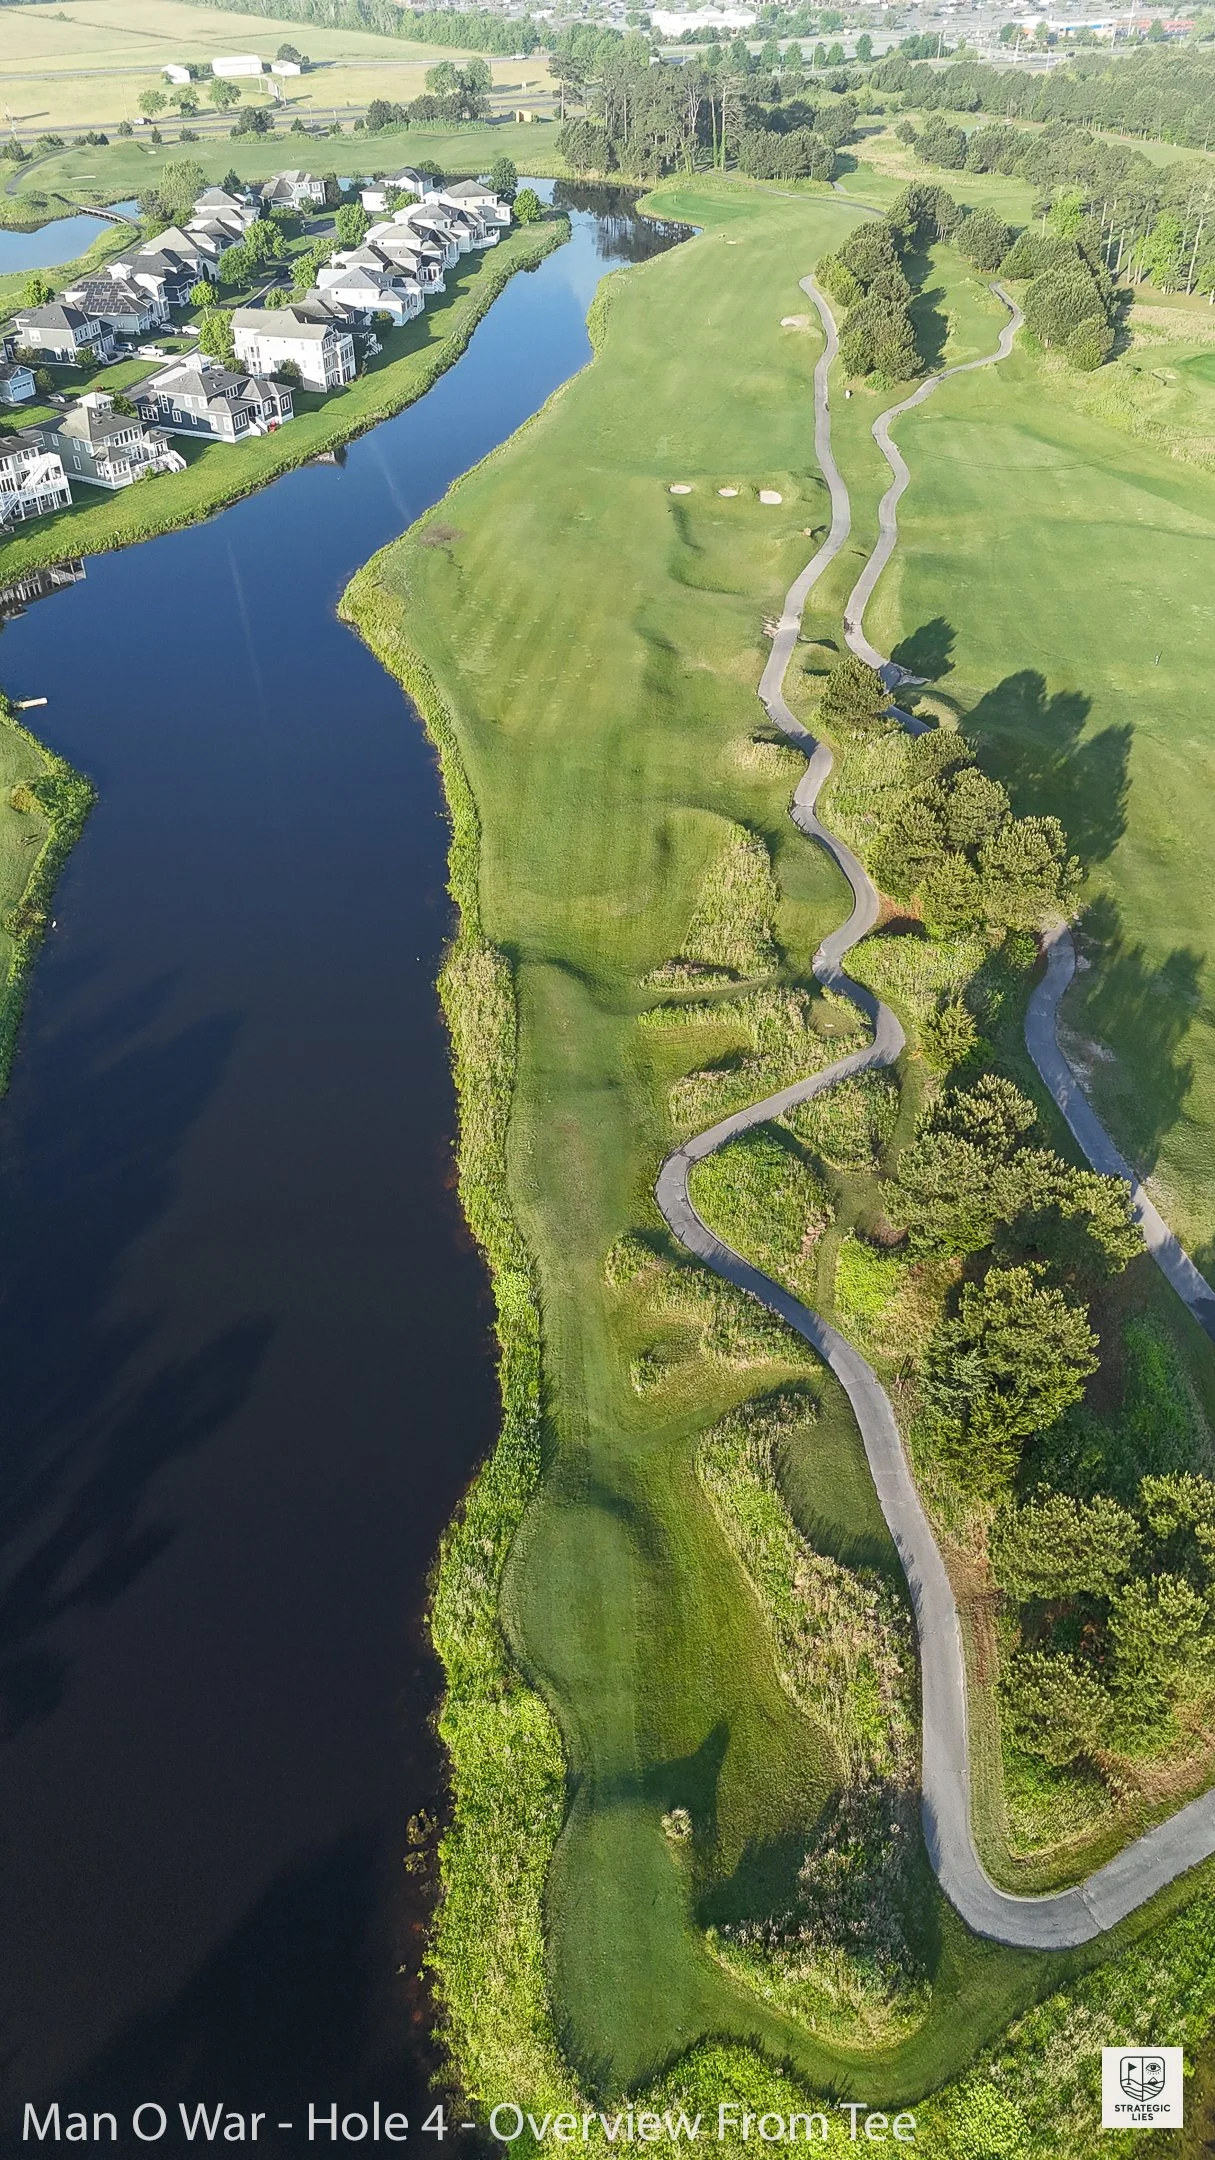
The Drive: Range bands (sectors) extending from the tee toward the fairway center.
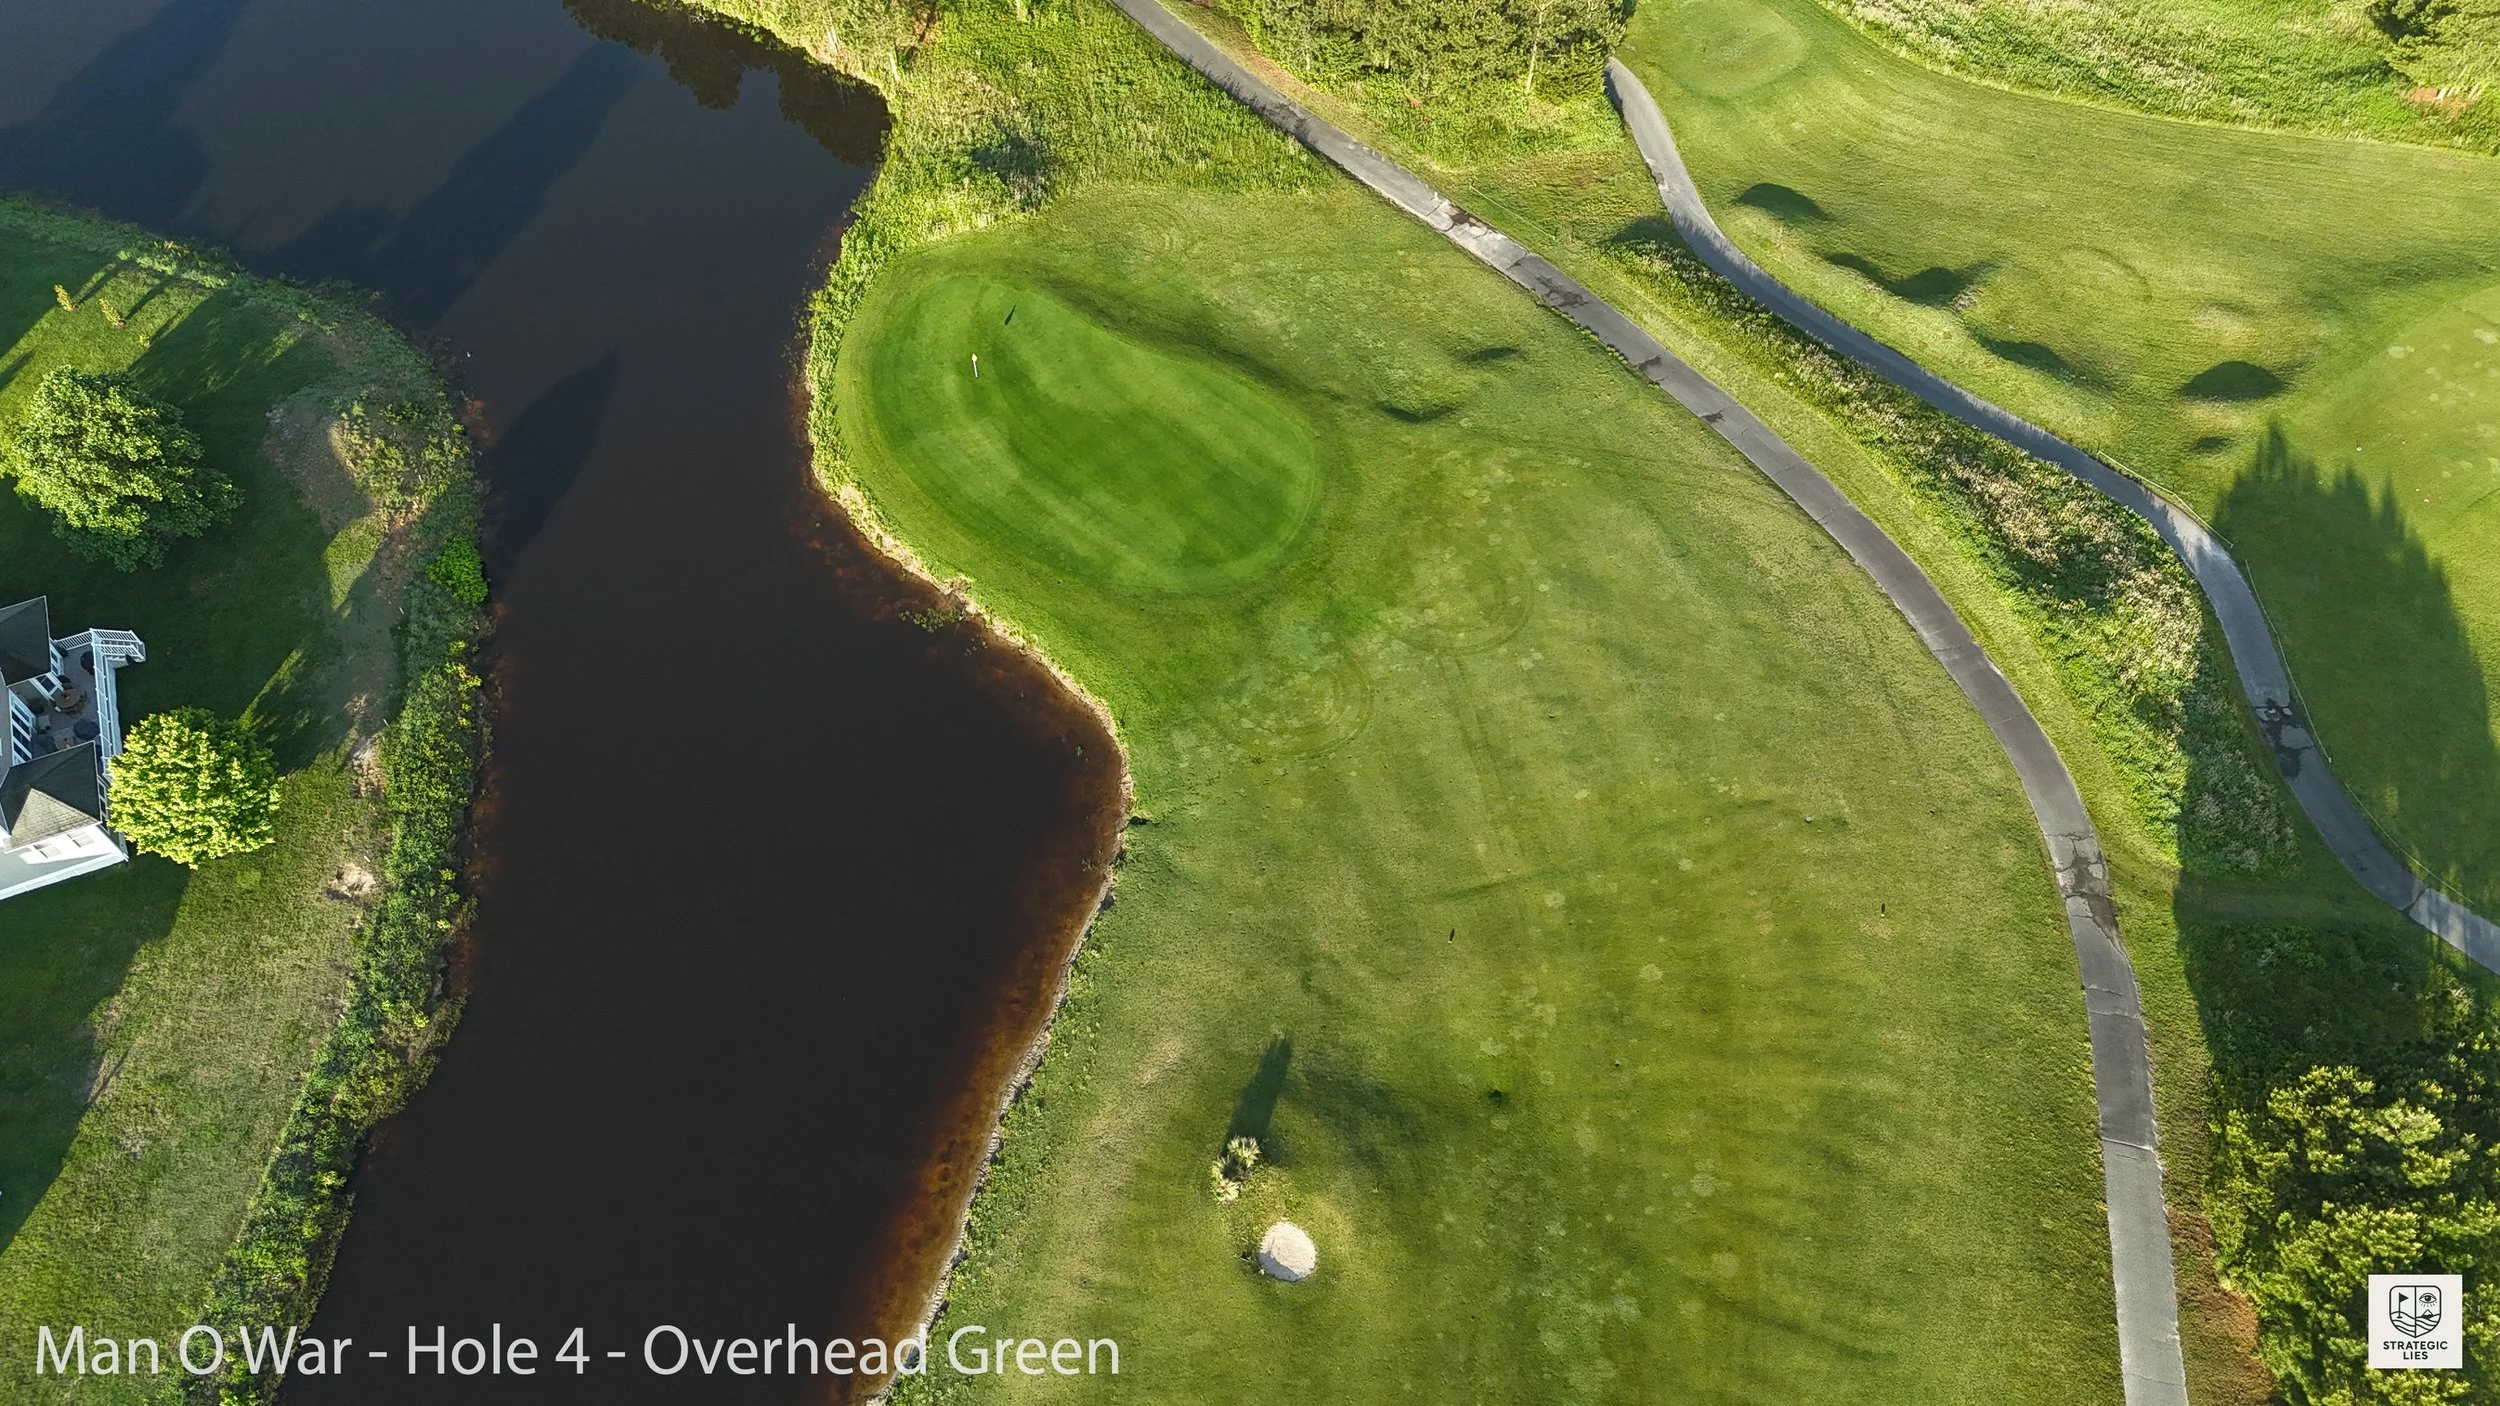
The Approach: Range bands extending back from the green.
This creates a "sweet spot" visual where the two sets of range bands overlap, helping a player choose the right club based on their personal shot data.
The Process: Automating Spatial Geometry
While I could have drawn these arcs manually, doing so for every tee color (Black, Blue, White, Red, Gold) across 18 holes is a massive undertaking. Instead, I developed a suite of PyQGIS scripts to handle the heavy lifting.
1. Connecting the Dots
The first step was building the backbone of each hole. I wrote a script, Draw Center Lines.py, that automatically finds the "Fairway Center" and "Green" points for each hole and draws a connecting line string. This establishes the orientation for the range sectors.
2. Generating the Range Sectors
The core of the project is Draws Ranges With Popups.py. This script uses trigonometry to calculate a "cone" of vision. It asks for:
The Source: (e.g., the Blue Tees or the Green).
The Angle: The width of the sector (I usually use 20°).
The Count: How many 50-yard bands to draw.
The script then calculates the points for each polygon ring using sine and cosine functions, ensuring every 50-yard marker is mathematically accurate to the hole's layout.
3. Streamlining the Workflow
Managing 18 holes of data can get messy. To keep the workspace clean, I created utility scripts like Filter All Layers By Hole Number.py and Clear All Filters.py. These allow me to instantly isolate a single hole across all data layers, making it easy to inspect the geometry against drone imagery.
4. Automated Export
Finally, the Export Images.py script automates the production of the final JPEGs. It iterates through every tee color, applies the correct filters, updates the layout map to follow the visibility of the specific tee's sectors, and saves the file with a clean naming convention (e.g., Rum Pointe - Hole 13 – Blue Tees.jpg).
The Result: Data-Driven Golf
The final products are clean, high-resolution cue cards that feel familiar to a golfer but carry the precision of a GIS professional. By combining drone photography with automated spatial analysis, we can provide a level of detail that a standard handheld GPS simply can't match.
Whether you're an analyst looking to apply GIS to your hobbies or a golfer looking for an edge, the takeaway is the same: Better data leads to better decisions.
Technical Tips for GIS Users
CRS Matters: When calculating distances in yards/meters, always transform your layers to a projected coordinate system (I used EPSG:3559).
Memory Layers: Creating sectors in a "memory" layer first allows you to validate the geometry before committing it to a permanent GeoPackage.